Excesses in one direction will lead to an opposite excess in the other direction.
– Bob Farrell’s 10 Market Rules
Every major cycle eventually reaches a point where optimism stops being rational and starts becoming reflexive. Investors begin extrapolating recent trends indefinitely into the future. Momentum attracts more momentum.
- We saw it during the dot-com bubble in 1999, when internet stocks detached from reality under the belief that a “new era” had arrived.
- We saw it again in the housing boom before 2008, when rising home prices convinced participants that risk had disappeared.
- In 2021, speculative excess returned through meme stocks, SPACs, and cryptocurrencies, where liquidity and enthusiasm overwhelmed fundamentals.
Today, many of those same psychological forces are reappearing in the artificial intelligence and semiconductor industries.
If you look at the Affimerce Fear & Greed Score, it sits at the Extreme Greed level.
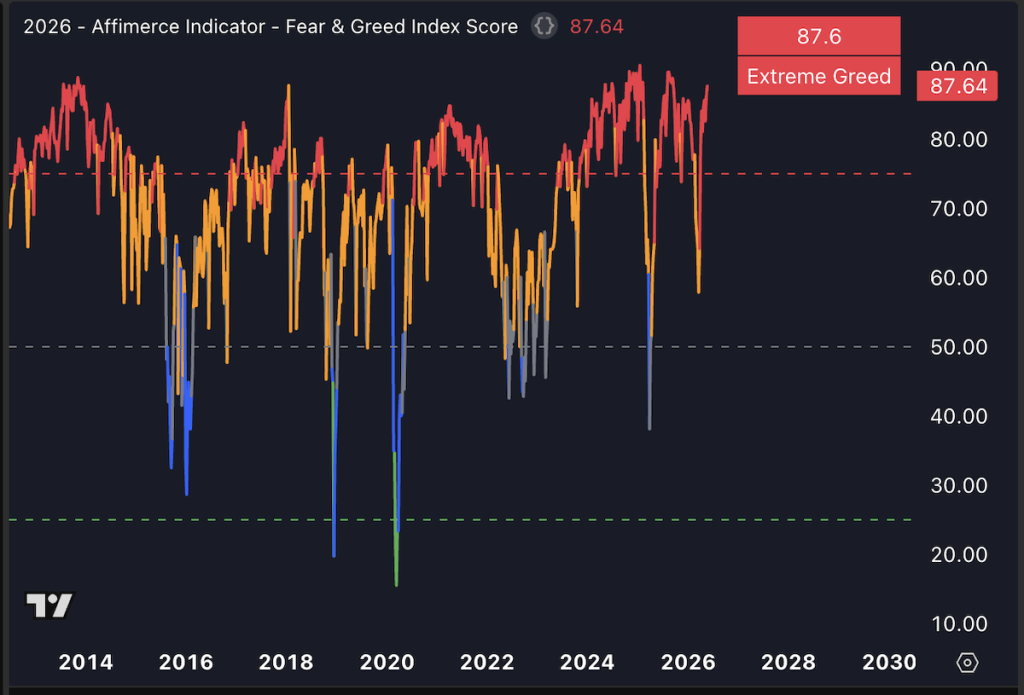
At the center of every market extreme is the same underlying mechanism: excess participation in one direction eventually creates instability in the opposite direction.
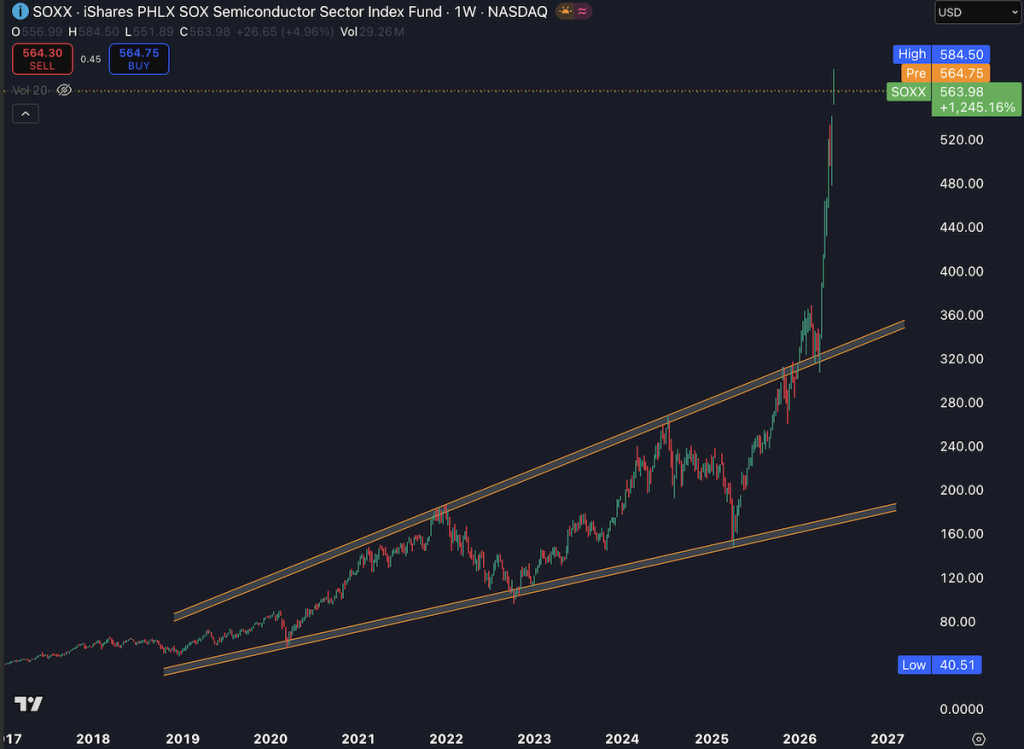
- SOXX is in a parabolic move, with relative strength near historical extremes.
- Semiconductor breadth remains strong as of 6/2/2026.
- Valuations are elevated across AI-related companies.
- The market is overvalued, and its concentration continues to increase.
- Extremes can stay longer than expected.
- But parabolas do not resolve sideways.
- We are witnessing history.
Human Psychology and Theme Driven
Human psychology has remained remarkably consistent across every major market cycle. Technologies evolve, narratives change, and new financial instruments emerge, but the greed and fear remain largely the same.
- Euphoric buying eventually leads to crowded positioning.
- Crowded positioning attracts momentum chasing.
- Passive inflows and trend-following strategies amplify the move even further.
- Retail FOMO accelerates late-stage participation.
Over time, concentrated narratives begin dominating capital flows across the market.
But beneath the surface, risks quietly begin to build.
- Valuations become increasingly stretched.
- Market breadth starts narrowing as leadership concentrates on fewer and fewer names.
- Positioning becomes fragile when too many participants lean in the same direction at the same time.
The market gradually becomes more dependent on continued momentum, continued liquidity, and continued optimism.
Eventually, the system reaches a point where even mildly disappointing news can trigger disproportionately violent reversals.
The goal of studying market extremes is not to predict an exact top or bottom.
Markets can stay irrational longer than you can remain solvent.
Instead, the goal is to recognize when risk and reward are becoming increasingly asymmetrical.
When upside optimism may already be heavily priced in, while downside risks are quietly expanding beneath the surface.
If you want to know more about human psychology and market cycles, please refer to Howard Marks’s book《Mastering the market cycle》.

Semiconductor Mania and Parabolic Move
The semiconductor trade has become the center of the artificial intelligence narrative, attracting enormous capital flows from institutional investors, passive index funds, momentum traders, and retail participants alike.
AI optimism has created a belief that semiconductor demand may remain structurally elevated for years, driving aggressive expectations for earnings growth, capital expenditures, and future market share expansion.
UBS recently raised its price target for Micron Technology (MU) significantly, from $535 to $1,625, while maintaining its “Buy” rating.
If you look at the weekly chart of SOXX below, it is not only a parabolic move up, but it is basically a straight vertical line.
At the same time, companies across the AI ecosystem are announcing massive spending plans.
Data center expansion, GPU demand, cloud infrastructure investment, and memory upgrades have fueled a capex cycle that many investors now view as nearly unstoppable.
This environment has created one of the strongest momentum trades in the market.
Eventually, price itself becomes the justification for even more buying.
This is where market behavior starts becoming reflexive.
In reflexive markets, rising prices improve sentiment, improved sentiment attracts additional flows, and additional flows push prices even higher. The cycle feeds on itself until expectations become increasingly detached from realistic business cycles and economic conditions.
Historically, semiconductors have been especially prone to these boom-and-bust dynamics.
The industry is deeply cyclical by nature. Periods of aggressive demand growth often encourage excessive capacity expansion, overly optimistic earnings expectations, and elevated valuations.
During bullish phases, investors begin pricing perfection into the sector, assuming continued demand acceleration, stable margins, and uninterrupted growth.
But semiconductor cycles rarely move in straight lines.
When growth expectations begin slowing, positioning can unwind extremely quickly. The same momentum and passive flows that amplify upside moves can accelerate downside volatility during reversals. What appears stable during euphoric phases can suddenly become fragile once sentiment shifts.
This is why semiconductor rallies often feel unstoppable near the top, and why corrections in the sector can become equally violent.
SOXX Extremes
One way to visualize how extreme semiconductor momentum has become is by measuring how far SOXX has deviated from its 200-day moving average.
Historically, large deviations from the 200DMA often signal that positioning and sentiment are becoming stretched.
- During normal market conditions, prices tend to oscillate around long-term moving averages as cycles expand and contract over time.
- But during periods of speculative enthusiasm, prices can separate dramatically from their long-term trend.
Today, SOXX has reached one of the most extended levels in its modern trading history (69.3% above its 200 DMA).
The Affimerce Indicator (Deviation from 200 DMA Indicator) was designed specifically to help visualize these types of long-term extremes.
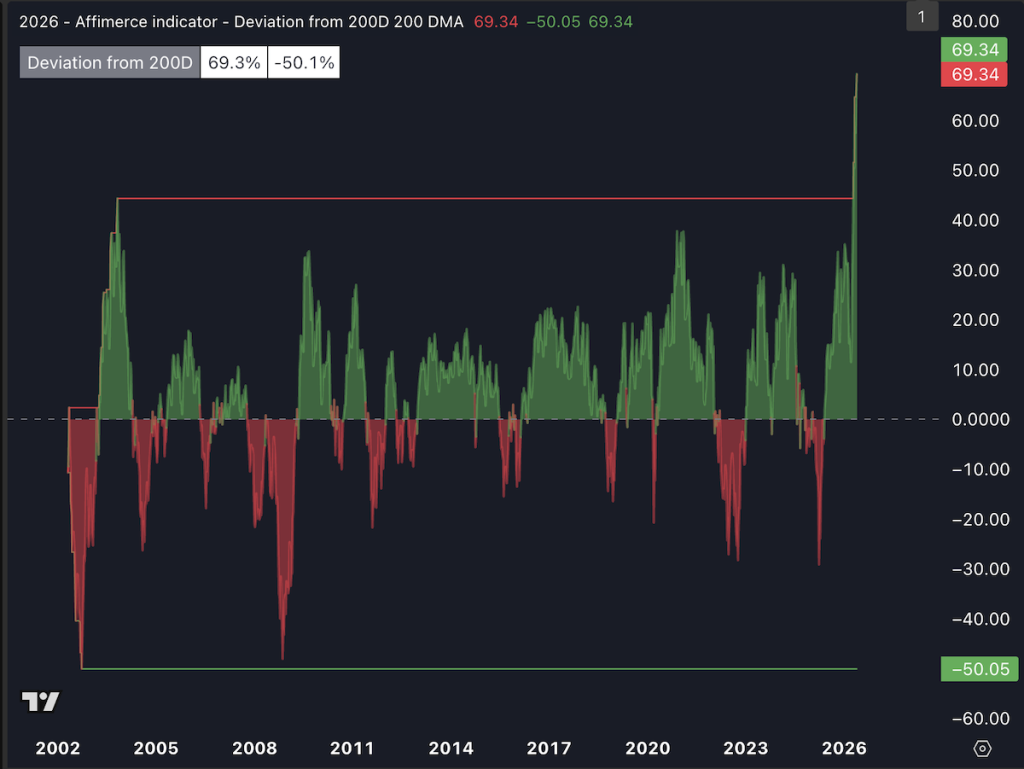
The current deviation is approaching levels rarely seen outside of major momentum-driven environments.
Similar types of extensions occurred during prior periods of market excess, including the post-dot-com recovery rally, the 2020-2021 liquidity-driven surge, and several AI-related momentum accelerations over the past few years.
Another method for measuring this statistical anomaly is the Z-score.
Currently, MRVL has reached an exceptional Z-score of 7.7, representing a nearly 7.7-standard-deviation (sigma) event.
Mathematically, a two-tailed 7-sigma event should occur once every 1.55 billion years.
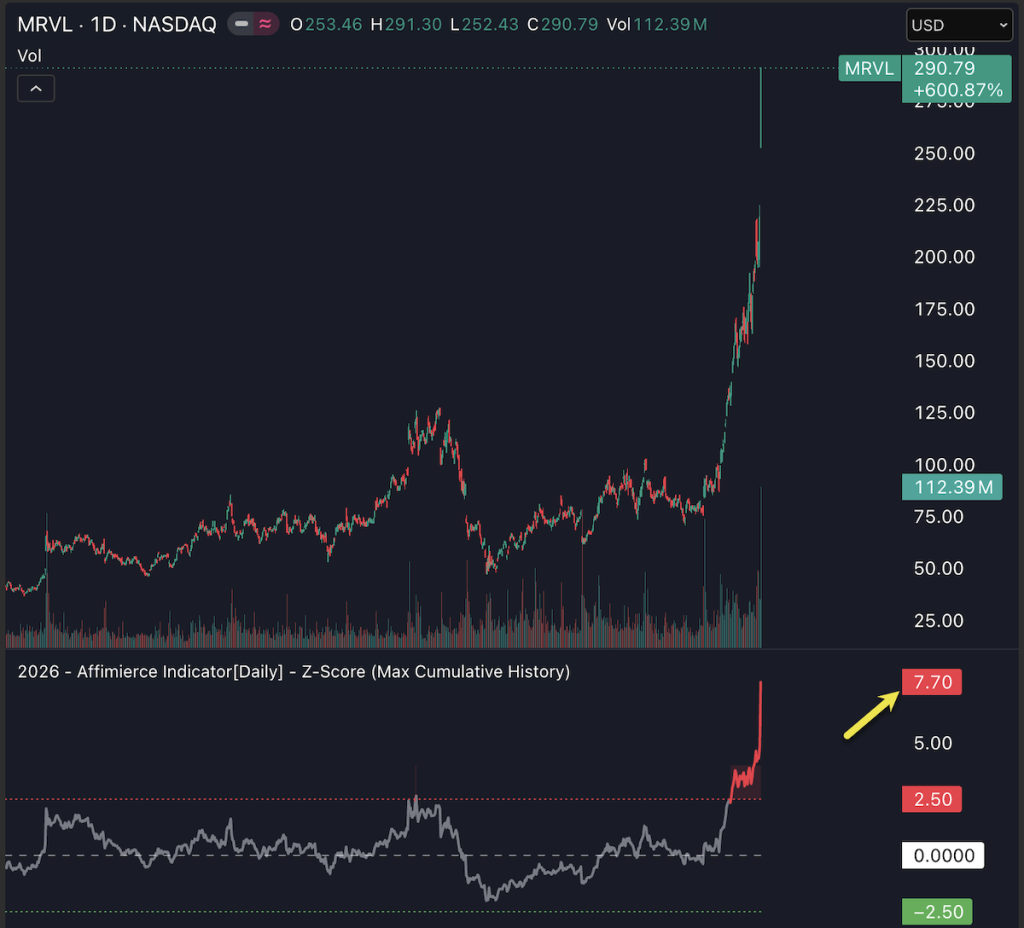
This does not automatically mean an immediate reversal is coming. Extreme momentum can persist far longer than most participants expect.
However, historically, the further the price deviates from the long-term trend equilibrium, the more unstable the environment eventually becomes.
This is especially important in semiconductors because the sector is inherently cyclical. Semiconductor markets tend to overshoot in both directions.
During bullish phases, investors often underestimate how quickly supply, demand, and earnings expectations can normalize. During bearish phases, pessimism can become equally excessive.
If you look at other metrics, such as RSI and MACD, they all show extremes in history.
Momentum extremes often appear before emotional crowding becomes obvious to most investors.
As of 5/28/2026, the RSIs are summarized below:
| Daily RSI | Weekly RSI | Monthly RSI | |
|---|---|---|---|
| Current RSI | 71.8 | 85.3 | 86.5 |
| Historically High | 87.2 | 85.3 | 86.9 |
| % historical high | 82.3% | 100% | 99.5% |
Strong markets often become dangerous when momentum itself starts accelerating vertically.
Another way to understand the intensity of the current semiconductor rally is through long-term MACD behavior.
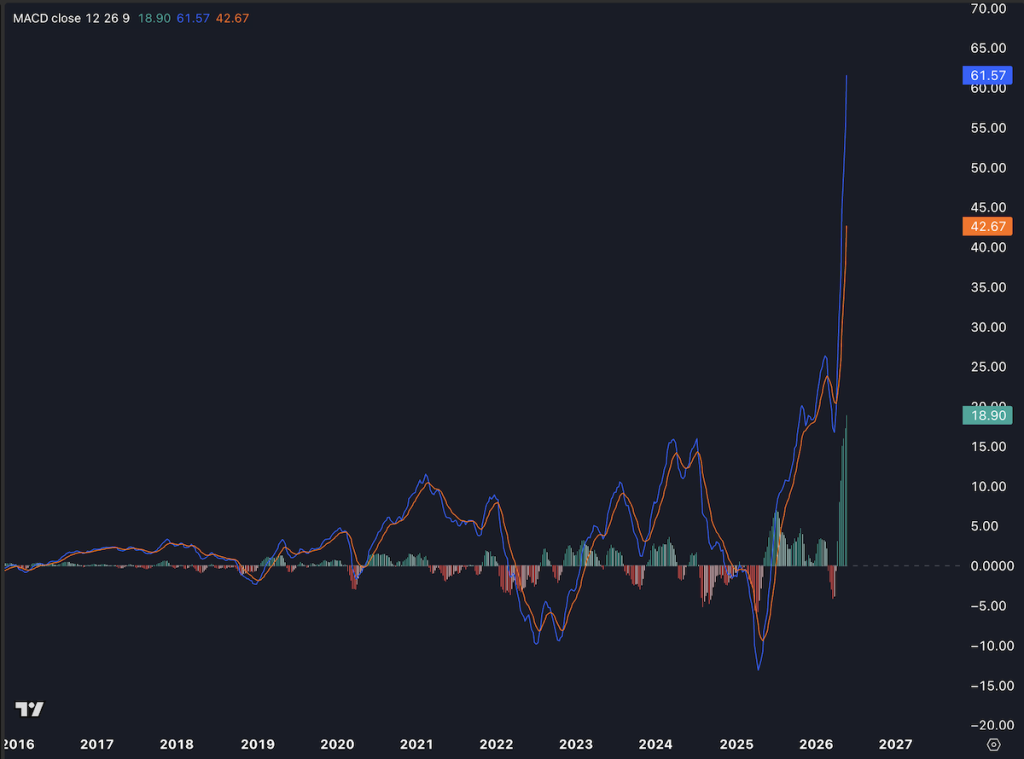
The MACD line has surged to 61.57, while the signal line has climbed to 42.67, both far above prior historical ranges shown over the past decade.
The MACD histogram has also expanded sharply to 18.90, reflecting unusually strong momentum acceleration over a very short period of time.
What makes this setup particularly notable is not simply that SOXX is trending higher, but that momentum itself is becoming increasingly vertical.
Historically, this type of MACD expansion has often appeared during late-stage momentum phases, when trend-following behavior, passive inflows, and narrative-driven buying begin reinforcing one another. As prices continue rising, additional capital flows into the same trade, creating a reflexive feedback loop.
While strong momentum can persist longer than expected, extreme MACD expansions also suggest that positioning may be becoming increasingly crowded and emotionally driven beneath the surface.
SOXX/SPY Ratio Extreme
One of the clearest signs of today’s semiconductor concentration can be seen in the SOXX/SPY ratio, which measures semiconductor performance relative to the broader S&P 500.
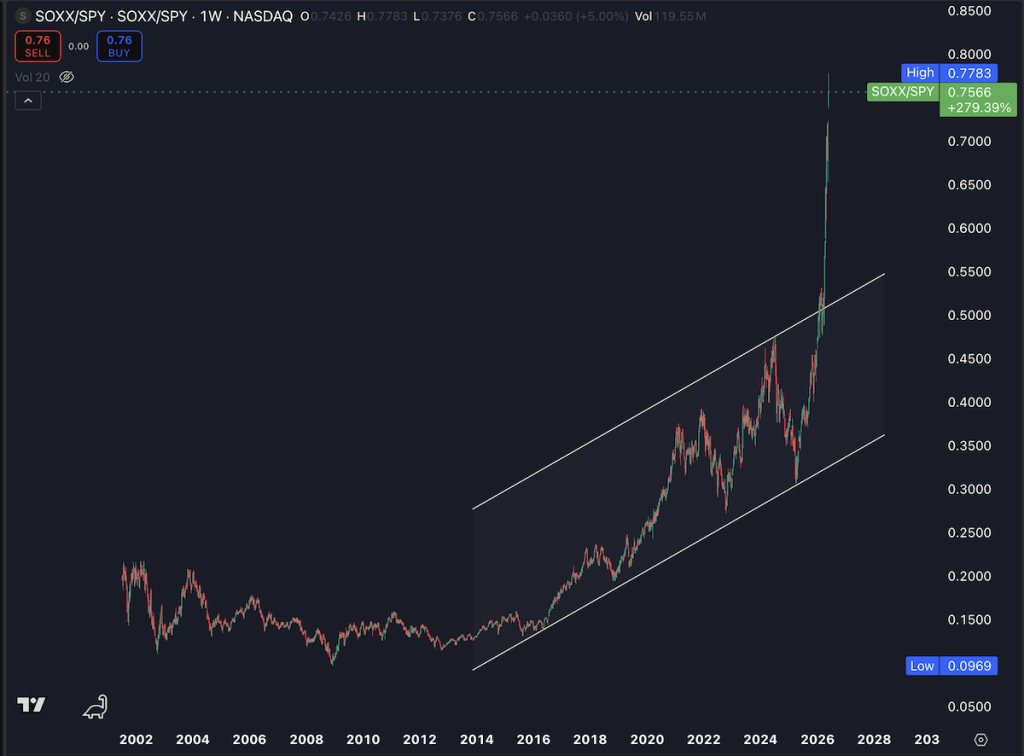
The ratio has surged to approximately 0.76, reaching the highest level in its recorded history and breaking far above the long-term rising channel that had contained relative performance for more than a decade.
From the 2009 low near 0.0969 to the recent peak around 0.7783, the ratio has climbed more than 700%, reflecting an extraordinary period of semiconductor outperformance versus the broader market.
What makes the current setup particularly notable is the speed and magnitude of the recent breakout.
Historically, SOXX/SPY tended to oscillate within a relatively stable long-term trend structure. However, the latest move has become increasingly vertical, suggesting that semiconductor leadership is no longer simply strong — it is becoming historically extreme.
This type of relative-strength expansion often occurs when market narratives become highly concentrated. Capital increasingly flows into the same group of AI and semiconductor-related names, while investors begin treating the sector as the primary engine of future market growth.
SOXX Breadth Analysis
Semiconductor breadth remains remarkably strong beneath the surface.
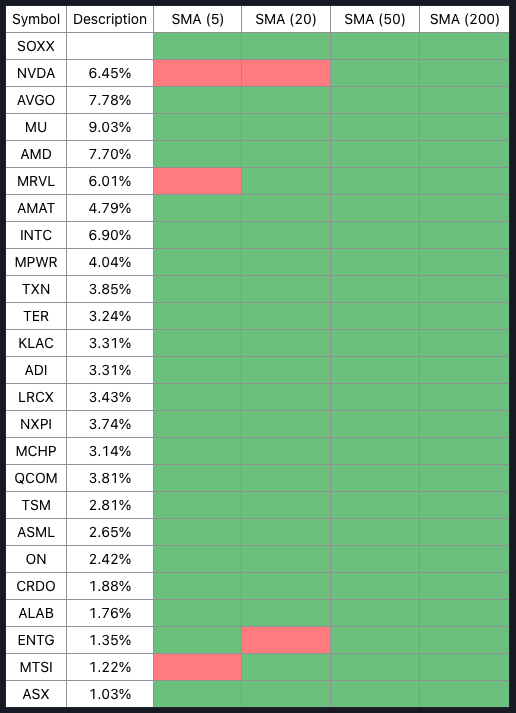
As of 5/28/2026, most major SOXX components continue trading above their 20-day, 50-day, and 200-day moving averages, suggesting that the rally is being supported by broad sector participation rather than only a few mega-cap names.
Large holdings such as Broadcom (7.78%), Micron (9.03%), AMD (7.70%), Intel (6.90%), Qualcomm (3.81%), and ASML (2.65%) all remain firmly above their major trend averages.
Even though Nvidia and Marvell are showing some short-term weakness below their 5-day and 20-day moving averages, the longer-term trend structure across the sector remains extremely strong.
This is important because many speculative market tops are typically accompanied by severe breadth deterioration beneath the surface. The current SOXX rally does not yet fully exhibit that type of internal weakness.
Instead, the semiconductor sector currently reflects broad participation combined with historically extreme momentum acceleration. It is a combination that can sustain powerful trends but can also create increasingly crowded and reflexive market behavior over time.
Market Concentration
The market is becoming increasingly concentrated around semiconductor companies and the Magnificent Seven.
As AI-related narratives continue dominating investor attention, capital flows are increasingly directed toward a relatively small group of companies tied to semiconductors, cloud infrastructure, hyperscalers, and AI spending.
SEMI Concentration
One of the defining characteristics of the current market cycle is the growing concentration of semiconductor exposure across major equity indices.
Technology-focused ETFs are becoming increasingly dependent on the performance of a relatively small group of semiconductor and AI-related companies.
- The Technology Select Sector SPDR ETF (XLK) now allocates roughly 42% to 48% of its portfolio to semiconductors and semiconductor equipment companies, including major holdings such as Nvidia, Broadcom, Micron, AMD, and Lam Research.
- The Invesco QQQ Trust (QQQ) currently holds approximately 30% to 34% semiconductor exposure, heavily influenced by companies tied to the AI infrastructure and data center ecosystem.
- The SPDR S&P 500 ETF (SPY)carries roughly 17% to 20% semiconductor exposure — an unusually high level historically for a diversified market index.
Let’s take a look at the XLK ETF, with its Top 10 holdings below:
| Rank | Ticker | Sector | Portfolio Weight |
|---|---|---|---|
| 1 | NVDA | SEMI | 13.72% |
| 2 | AAPL | 11.90% | |
| 3 | MSFT | 8.12% | |
| 4 | MU | SEMI | 6.45% |
| 5 | AMD | SEMI | 5.26% |
| 6 | AVGO | SEMI | 5.26% |
| 7 | INTC | SEMI | 3.71% |
| 8 | CSCO | 2.99% | |
| 9 | LRCX | SMEI | 2.58% |
| 10 | AMAT | SEMI | 2.31% |
| Total of SEMI in Top 10 | 34% |
Among the top 10 holdings, 7 are semiconductor companies, representing a combined portfolio weight of approximately 34%.
| Rank | Ticker | Sector | Portfolio Weight |
|---|---|---|---|
| 1 | NVDA | SEMI | 8.39% |
| 2 | AAPL | 7.27% | |
| 3 | MSFT | 4.97% | |
| 4 | AMZN | 4.58% | |
| 5 | MU | SEMI | 4.47% |
| 6 | AMD | SEMI | 3.64% |
| 7 | GOOGL | 3.64% | |
| 8 | TSLA | 3.48% | |
| 9 | GOOG | 3.36% | |
| 10 | AVGO | SEMI | 3.21% |
| Total of SEMI in Top 10 | 19.7% |
This level of concentration demonstrates how increasingly dependent major technology indices have become on the semiconductor and AI ecosystem.
As these companies continue outperforming, passive and market-cap weighted ETFs are forced to allocate even more capital into the same names, reinforcing momentum and further increasing concentration risk across the broader market.
This type of feedback loop is one of the defining features of reflexive markets.
The larger semiconductor companies become, the more influence they exert over index performance, passive fund flows, and overall market direction.
As a result, the broader market is becoming increasingly sensitive to the fortunes of a single dominant narrative: artificial intelligence and semiconductor growth.
SPY/RSP
Another important sign of increasing market concentration can be seen in the SPY/RSP ratio.
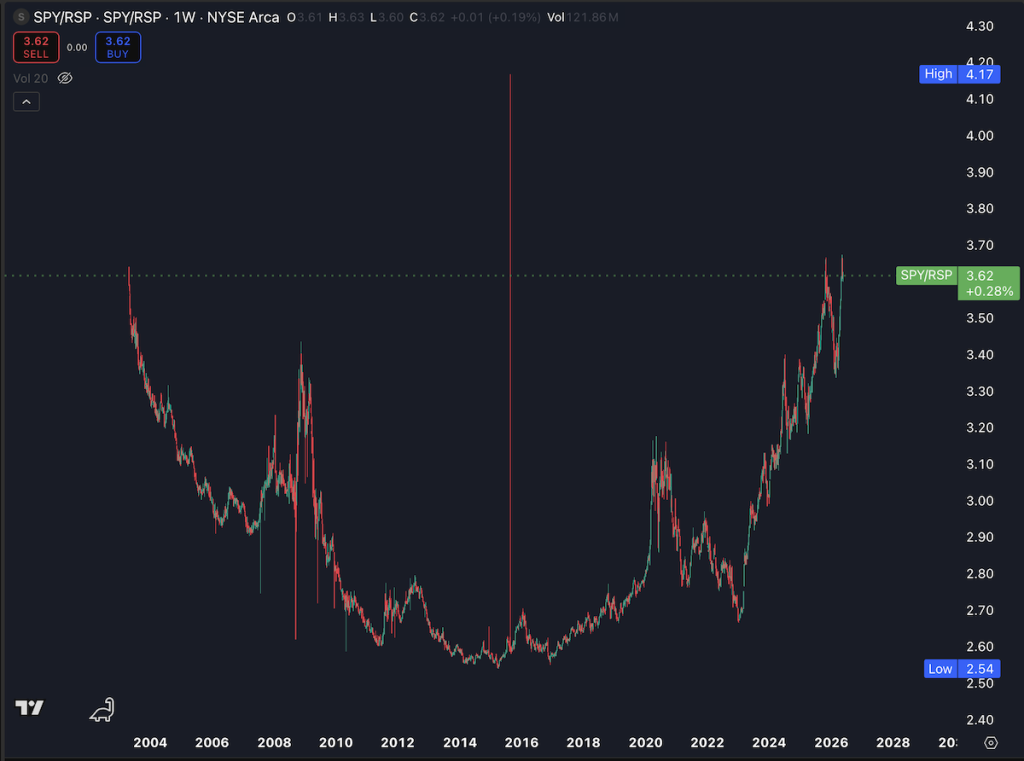
The ratio recently climbed to approximately 3.62, approaching its historical high near 4.17 and remaining far above the long-term low around 2.54.
In practical terms, this means a relatively small group of mega-cap companies is driving a disproportionate share of overall market performance.
The current Top 10 holdings of SPY are listed below:
| Rank | Companies | Category | Weight |
|---|---|---|---|
| 1 | NVDA | SEMI | 8.16% |
| 2 | AAPL | Mag 7 | 7.07% |
| 3 | MSFT | Mag 7 | 4.85% |
| 4 | AMZN | Mag 7 | 4.06% |
| 5 | GOOGL | Mag 7 | 3.48% |
| 6 | AVGO | SEMI | 3.06% |
| 7 | GOOG | Mag 7 | 2.77% |
| 8 | META | Mag 7 | 2.08% |
| 9 | TSLA | Mag 7 | 1.87% |
| 10 | BRK.B | 1.39% | |
| Total | 38.7% |
As shown in the table above, the top 10 holdings account for nearly 40% of the SPY ETF. Among them, two semiconductor companies — Nvidia (NVDA) and Broadcom (AVGO) — represent roughly 12% of the index alone.
Most of the remaining top holdings (roughly 27%) are the “Magnificent Seven,” many of which are major customers, infrastructure partners, or ecosystem beneficiaries of the semiconductor and AI supply chain.
This highlights how increasingly concentrated the broader market has become around a relatively small group of AI- and semiconductor-related companies.
As capital increasingly flows into dominant technology and semiconductor-related names, market leadership becomes more concentrated. Passive index structures reinforce this trend because larger companies receive larger allocations simply due to rising market capitalization.
Historically, elevated SPY/RSP ratios often reflect periods when market performance becomes heavily dependent on a narrow group of leadership stocks.
Overvalued SEMI
Valuation is another important sign of how much optimism has already been priced into the semiconductor and AI ecosystem.
Many leading semiconductor companies and members of the Magnificent Seven are now trading at historically elevated valuation levels relative to both their own long-term averages and the broader market.
AMD provides a good example of this trend. As shown in the chart below, AMD’s stock price has continued climbing alongside the upper end of its historical P/S valuation band, reflecting increasingly aggressive market expectations tied to AI growth and future earnings expansion.
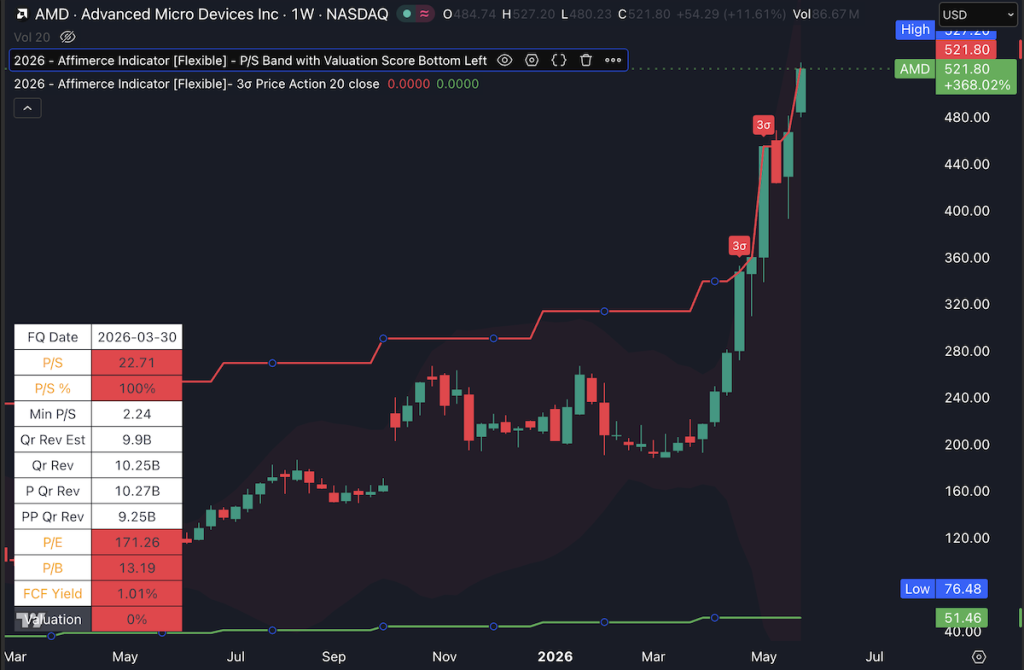
Currently, AMD’s price-to-sales (P/S) ratio has reached approximately 22.63, at an all-time high. Its price-to-earnings (P/E) ratio has also surged to roughly 171, an exceptionally elevated level historically for a cyclical semiconductor company.
At the same time, the Affimerce Valuation Score has fallen to 0 out of 100, indicating that valuation metrics are now approaching historically extreme territory.
The same thing happens to most of the SEMI names, such as MU, AVGO, INTC, AMAT, and so on and on.
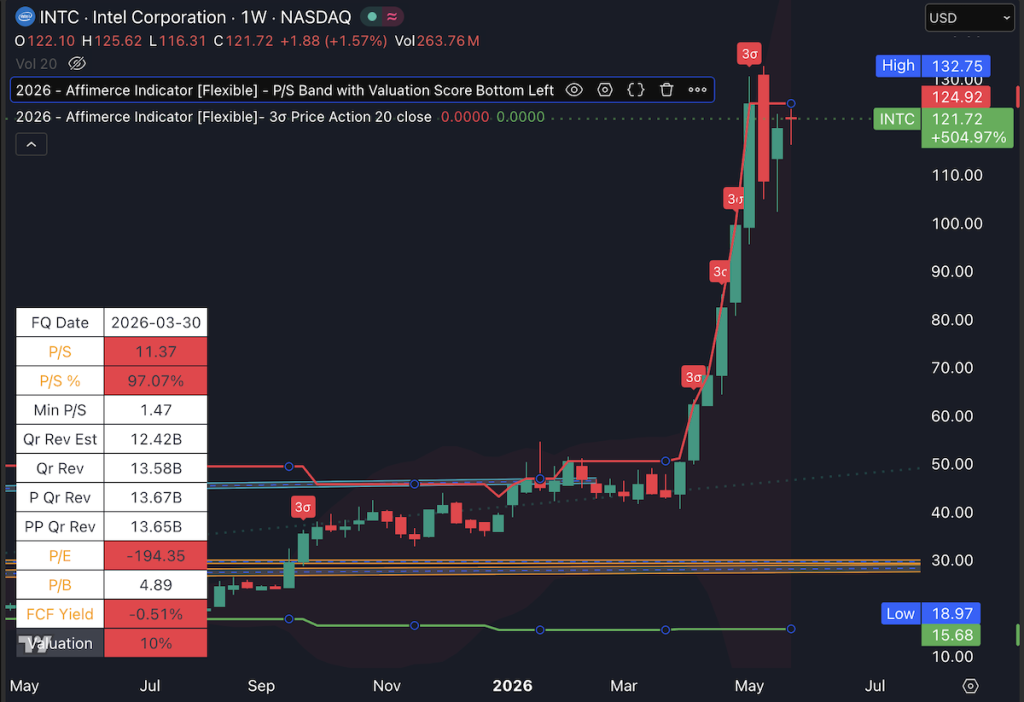
As shown above, Intel’s current P/S ratio has risen to approximately 11.37, close to historical extremes for the company, while its Affimerce Valuation Score remains deeply depressed at only 10 out of 100.
What makes Intel particularly notable is that the company is still undergoing a difficult business transition, facing intense competition, large capital spending requirements, and ongoing execution challenges.
Despite these uncertainties, the stock has participated aggressively in the broader AI and semiconductor momentum trade.
Overvalued Markets
Valuation metrics across the broader U.S. equity market are also approaching historically elevated levels, suggesting that optimism is no longer limited to semiconductors alone.
One important measure is the Shiller CAPE Ratio (Cyclically Adjusted P/E Ratio), which smooths earnings over 10 years to reduce the impact of economic cycles.
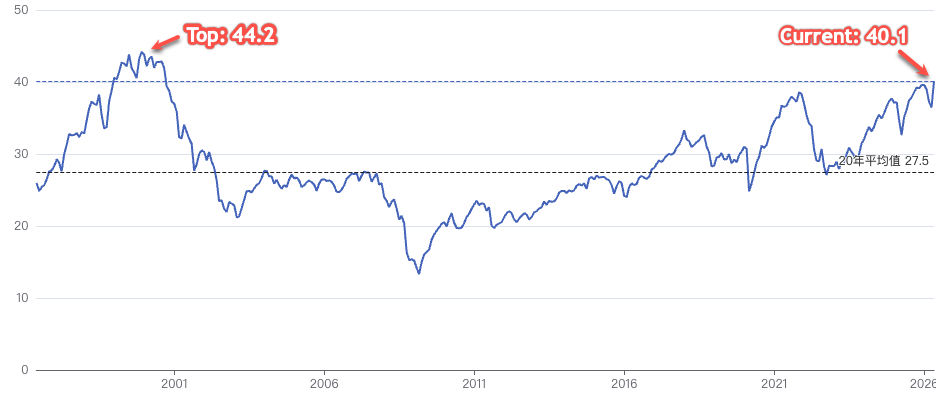
As shown above, the current Shiller P/E has risen to approximately 40.1, compared to its 20-year average of 27.5. The only major period with meaningfully higher valuations occurred during the peak of the dot-com bubble, when the ratio briefly reached around 44.2 in 2000.
Another widely followed valuation measure is the Buffett Indicator, which compares total U.S. stock market capitalization to GDP.
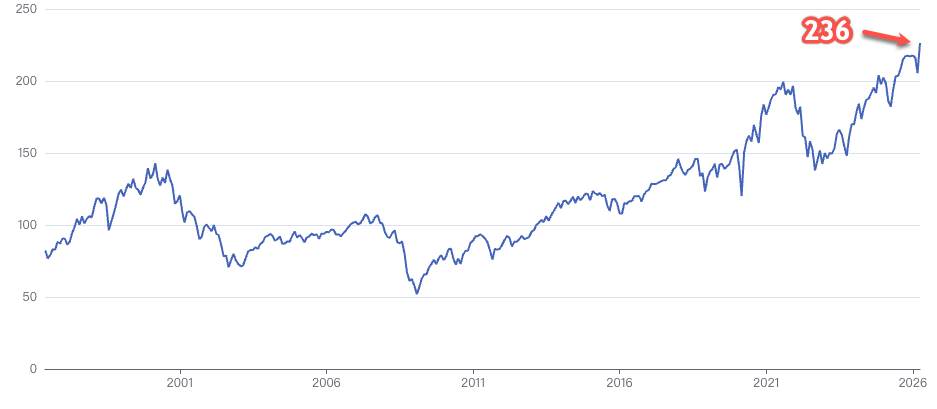
Historically, higher readings suggest that market valuations are becoming increasingly detached from the size of the underlying economy.
The current Buffett Indicator has climbed to approximately 236%, one of the highest levels ever recorded.
Together, these metrics suggest that investors are pricing in exceptionally optimistic assumptions for future growth, earnings, liquidity, and AI-related expansion.
This does not necessarily mean the market must reverse immediately. Historically, overvalued markets can remain expensive for extended periods of time, especially during strong momentum-driven cycles.
However, elevated valuation environments also tend to reduce the long-term margin of safety.
When expectations become extremely optimistic, markets often become increasingly vulnerable to earnings disappointments, slower economic growth, rising interest rates, or shifts in investor sentiment.
Markets rarely peak when valuations are merely expensive.
They often peak when investors begin believing valuation no longer matters.
1999 vs. Today — Different Narratives, Similar Psychology
While today’s AI-driven market environment is not identical to the dot-com bubble of 1999, there are important similarities in market behavior, concentration, and investor psychology.
In both periods, investors became increasingly convinced that a transformational technology would permanently reshape the economy.
- In 1999, the dominant narrative was the Internet.
- Today, it is artificial intelligence, cloud infrastructure, and semiconductor computing power.
The underlying psychology, however, remains remarkably similar.
As optimism accelerates, capital increasingly concentrates into a relatively small group of perceived “must-own” companies.
Relative strength expands dramatically, valuations become increasingly difficult to justify using traditional frameworks, and investors begin extrapolating future growth far into the future.
The SOXX/SPY ratio reflects this dynamic clearly. Semiconductor stocks are now outperforming the broader market at one of the most extreme levels in modern history, with the ratio recently reaching approximately 0.76 and breaking far above its long-term trend channel.
This type of relative-strength expansion is often associated with periods when a dominant market narrative begins attracting disproportionate amounts of capital.
Market concentration also continues rising rapidly.
Today, the Magnificent Seven and semiconductor-related companies account for an increasingly large share of index performance. In the SPY ETF, the top 10 holdings now represent nearly 40% of the entire index.
Semiconductor companies alone account for roughly 12% of SPY’s top holdings, while many of the remaining mega-cap technology companies are deeply connected to the AI and semiconductor ecosystem.
There are, however, important structural differences between 1999 and today.
During the dot-com bubble, market participation was driven heavily by speculative retail trading and active mutual fund managers. Today’s market is increasingly influenced by passive index flows, ETF allocations, systematic strategies, options-related positioning, and trend-following models.
This distinction matters because passive investing can mechanically reinforce concentration. As semiconductor and AI-related companies outperform, market-cap weighted ETFs automatically allocate even more capital into the same names, creating a self-reinforcing feedback loop.
In other words, strong performance itself becomes a driver of additional inflows.
That dynamic did not exist at today’s scale during the late 1990s.
At the same time, there are also meaningful differences in fundamentals. Unlike many speculative internet companies during the dot-com era, today’s leading semiconductor and AI infrastructure companies are generating enormous revenues, free cash flow, and real business demand tied to data centers, cloud computing, and AI infrastructure expansion.
This is why the current environment may be better described not as a direct replay of 1999, but as a modern form of momentum concentration driven by AI narratives, passive capital flows, and historically extreme relative strength.
Different technologies. Different market structures.
But very similar human psychology.
Why The Bull Case Still Matters
Despite the growing signs of concentration, momentum extremes, and elevated valuations, the bullish case for semiconductors and AI-related companies should not be dismissed.
Unlike many speculative periods in market history, today’s leading technology and semiconductor companies are generating substantial revenues, free cash flow, and real earnings growth. AI demand is not purely theoretical.
Hyperscalers continue investing aggressively in data centers, cloud infrastructure, networking, and high-performance computing to support rapidly growing AI workloads.
If you look at the Affimerce Financial Engine and Profitability Engine, those Semi names are doing a very good job.
At the same time, semiconductor breadth remains remarkably strong. A large majority of SOXX components continue trading above their major moving averages, suggesting that participation across the sector remains broad rather than narrowly concentrated in only a few names.
This is also an important distinction compared to the dot-com bubble of 1999. Many internet companies during that era had little or no profitability, weak business models, and highly speculative valuations disconnected from actual cash flow generation. In contrast, today’s leading semiconductor and AI infrastructure companies are highly profitable businesses with dominant market positions and enormous global demand.
For this reason, the current environment may not represent a traditional speculative bubble in the classic sense. Instead, it may reflect a market that is simultaneously supported by genuine technological transformation, strong earnings growth, and increasingly aggressive investor positioning.
That combination is precisely what makes modern market extremes so complex — and so difficult to navigate.
Why Market Extremes Often Persist Longer Than Expected
Market extremes are difficult because they often last much longer than fundamentals alone would suggest.
Once a powerful trend is established, multiple forces can continue reinforcing it. Passive index flows keep allocating capital toward the largest winners. Momentum traders chase relative strength. Trend-following systems add exposure as prices continue moving higher. Retail investors join late as the dominant narrative becomes more widely accepted.
This creates a self-reinforcing cycle.
Rising prices improve sentiment. Better sentiment attracts more capital. More capital pushes prices even higher. As long as earnings expectations remain strong and liquidity conditions stay supportive, the trend can continue well beyond what appears rational.
That is why extreme conditions should not be treated as immediate timing signals. A market can be overextended, expensive, and crowded — and still keep rising.
Final Thoughts: When Strength Becomes Risk
Market extremes are rarely obvious in real time.
In fact, the strongest markets often feel the safest. Volatility remains low, pullbacks become shallow, analysts raise price targets, and investors grow increasingly confident that the dominant narrative will continue indefinitely.
That is precisely why extremes become so difficult to recognize.
Today’s market environment continues to exhibit many signs of exceptional strength: strong semiconductor breadth, powerful momentum, broad participation across AI-related companies, and persistent capital inflows into technology and passive index structures.
At the same time, however, the market is also becoming increasingly concentrated, momentum-driven, and dependent on a relatively small group of semiconductor and AI-related companies to sustain overall index performance.
This does not necessarily mean an immediate reversal is approaching. Market extremes can persist far longer than expected, especially in environments supported by strong liquidity, passive inflows, and powerful narratives.
But history repeatedly shows that when positioning, momentum, and concentration simultaneously reach historical extremes, risk and reward often begin shifting in less favorable ways beneath the surface.
Different technologies.
Different market structures.
But the same human psychology.
Leave a Reply